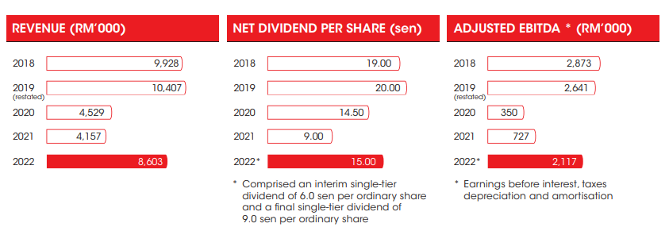
| Revenue |
8,603.0 |
4,156.7 |
4,528.8 |
10,406.9 |
9,927.7 |
| Adjusted EBITDA |
2,116.6 |
727.0 |
350.3 |
2,641.4 |
2,872.8 |
| Profit/(loss) before taxation |
(342.2) |
(1,147.70) |
(2,137.5) |
1,489.4 |
(4.0) |
| Taxation |
(325.2) |
96.7 |
(224.0) |
(157.2) |
(82.3) |
| Profit/(loss) for the financial year |
(667.4) |
(1,051.0) |
(2,361.5) |
1,332.2 |
(86.3) |
| Profit/(loss) attributable to equity holders of the Company |
(520.0) |
(946.8) |
(2,263.8) |
1,395.3 |
(19.5) |
| Share capital |
1,764.5 |
1,764.5 |
1,764.5 |
1,764.5 |
1,764.5 |
| Retained earnings |
10,034.6 |
11,407.0 |
12,813.1 |
16,206.4 |
15,872.2 |
| Other reserves |
1,781.3 |
1,598.2 |
1,322.1 |
1,524.8 |
1,583.1 |
| Treasury shares |
(944.5) |
(985.9) |
(987.9) |
(998.1) |
(999.1) |
|
12,635.9 |
13,783.8 |
14,911.8 |
18,497.6 |
18,220.7 |
| Non-controlling interests |
(706.9) |
(531.2) |
(411.2) |
(327.6) |
(267.4) |
| Non-current liabilities |
12,953.6 |
14,111.7 |
10,808.8 |
10,415.3 |
10,381.2 |
|
24,882.6 |
27,364.3 |
25,309.4 |
28,585.3 |
28,334.5 |
| Property, plant and equipment |
15,380.8 |
16,007.9 |
16,052.4 |
16,620.9 |
14,840.9 |
| Land held for property development |
199.1 |
180.5 |
184.6 |
184.6 |
184.7 |
| Investment properties |
1,884.1 |
1,835.6 |
1,729.7 |
1,895.6 |
2,204.4 |
| Intangible assets |
4,083.6 |
4,183.4 |
4,247.7 |
4,472.8 |
4,527.3 |
| Right-of-use assets |
627.7 |
670.4 |
741.6 |
872.0 |
– |
| Joint Venture |
42.8 |
42.9 |
– |
– |
– |
| Associate |
2,062.2 |
1,685.5 |
1,052.2 |
629.5 |
– |
| Financial assets at fair value through other comprehensive income |
67.9 |
64.6 |
62.3 |
115.9 |
117.1 |
| Financial assets at fair value through profit or loss |
119.0 |
130.4 |
118.1 |
122.7 |
– |
| Other non-current assets |
337.1 |
49.2 |
102.2 |
74.0 |
254.5 |
| Deferred tax assets |
29.4 |
34.1 |
31.7 |
262.1 |
250.2 |
| Total non-current assets |
24,882.6 |
24,884.5 |
24,322.5 |
25,250.1 |
22,379.0 |
| Net current assets |
48.9 |
2,479.8 |
986.9 |
3,335.2 |
5,955.5 |
|
24,882.6 |
27,364.3 |
25,309.4 |
28,585.5 |
28,334.5 |
| Basic earnings/(loss) per share (sen) |
(9.2) |
(16.8) |
(40.0) |
24.7 |
(0.4) |
| Net dividend per share (sen) |
15.0# |
9.0 |
14.5 |
20.0 |
19.0 |
| Dividend cover (times) |
N/A |
N/A |
N/A |
1.2 |
N/A |
| Current ratio |
1.0 |
1.8 |
1.3 |
1.7 |
2.8 |
| Net assets per share (RM) |
2.23 |
2.44 |
2.64 |
3.27 |
3.22 |
| Return (after tax and non-controlling interests) on average shareholders’equity (%) |
(3.9) |
(6.6) |
(13.6) |
7.6 |
(0.1) |
| Market share price |
|
| -highest(RM) |
3.09 |
3.29 |
3.36 |
3.90 |
5.80 |
| -lowest(RM) |
2.52 |
2.36 |
1.83 |
2.95 |
2.79 |
# Comprised a special single-tier dividend of 9.0 sen per ordinary share.